#
Google BigQuery
Google BigQuery is a massively-parallel analytics engine ideal for working with tabular data. Through our collaboration with the Institute for Systems Biology Cancer Gateway in the Cloud (ISB-CGC), open-access HTAN BigQuery tables are now available, and updated with each major HTAN release.
HTAN BigQuery tables can be accessed through the ISB-CGC Table Search UI and via the HTAN Data Portal.
For complete documentation regarding ISB-CGC BigQuery functionality, check out their online documentation.
Google Accounts
You must have a Google account to access Google Big Query.
Google Cloud Platform’s free tier allows users to access many common Google Cloud resources, including BigQuery free of charge and query up to 1 TB of data per month for free.
#
Accessing Metadata tables
HTAN metadata is organized by data type and level (see HTAN Data Model), with each BigQuery table containing data from all HTAN Centers combined.
Metadata tables can be accessed from the Atlases tab of the HTAN Data Portal. Click the icon under the Metadata column and scroll down to the Google BigQuery link at the bottom of the popup window.
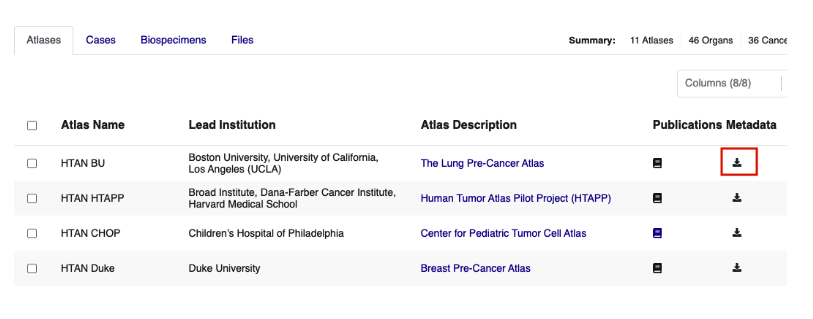
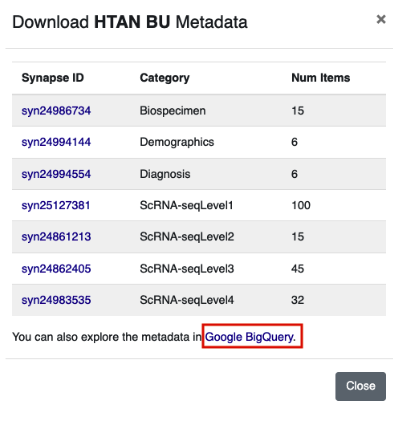
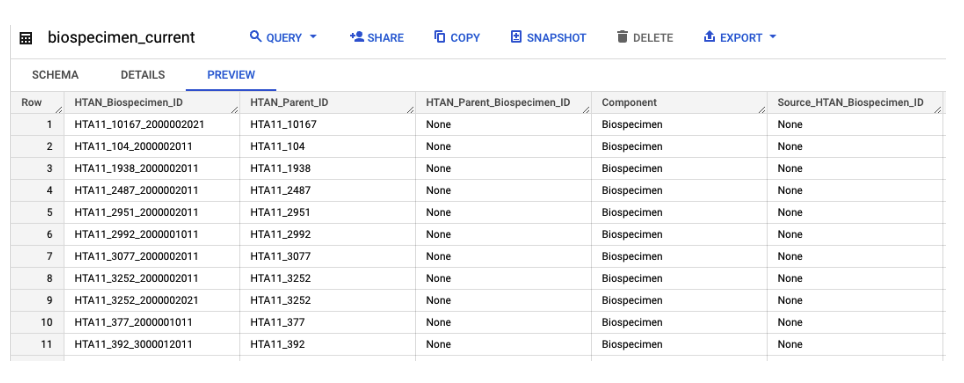
This link will take you to the ISB-CGC Table Search UI filtered to HTAN tables. Browse the table listing to find your table of interest, and click the magnifying glass icon under Open to launch the table in the BigQuery console.

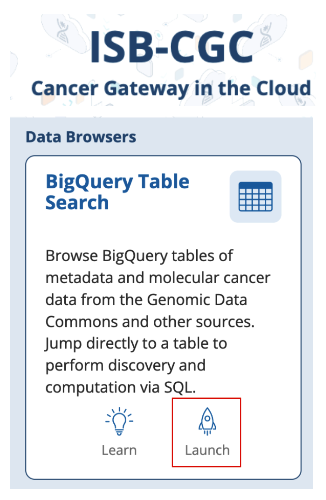
Alternatively, you can start at the ISB-CGC Table Search UI and select Launch under BigQuery Table Search.
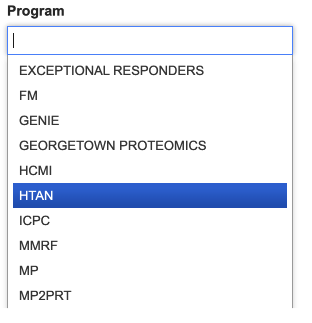
Then filter for HTAN tables by selecting HTAN from the Program dropdown.
#
Example Query
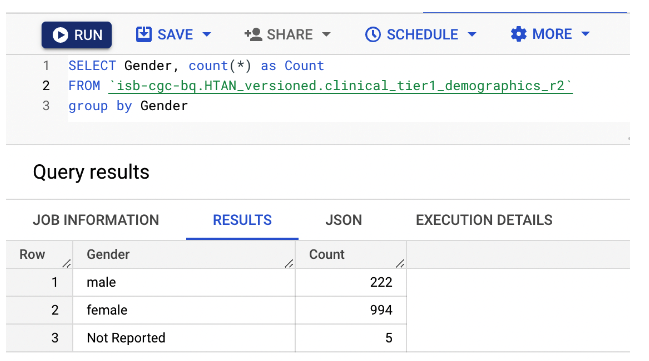
As an example, this simple query tabulates the overall distribution of gender in HTAN, as reported in the HTAN Clinical Demographics BigQuery table isb-cgc-bq.HTAN_versioned.clinical_tier1_demographics_r2. For complete details on running queries and the Biq Query syntax, refer to the Google BiqQuery Documentation.
#
Accessing Single Cell Tables
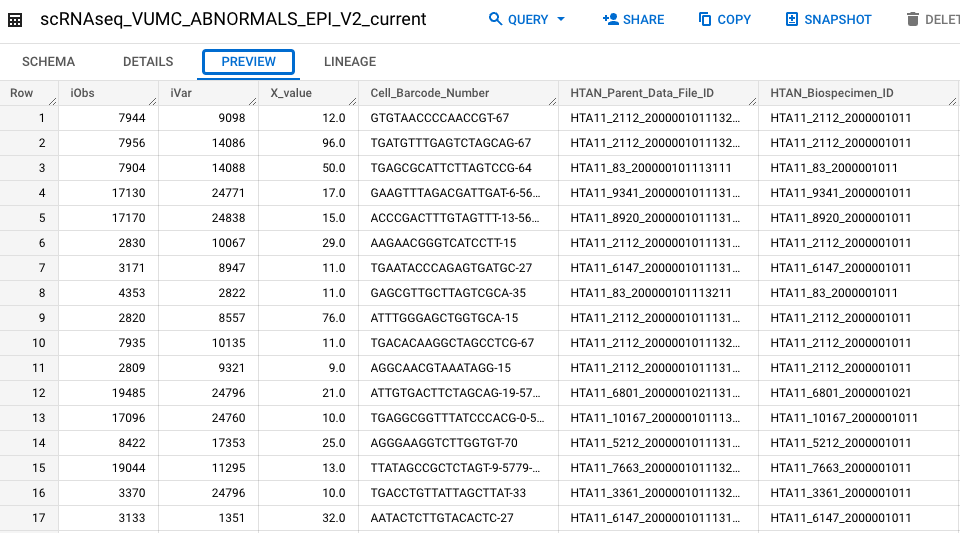
We currently host multiple single cell BigQuery tables via ISB-CGC. These tables are derived from level 4 H5AD AnnData files submitted by HTAN centers.
When a BigQuery table is available for a given file, a link will be visible in the View Column of the HTAN Data Portal.

This link will take you to the ISB-CGC Table Search UI listing for the selected single cell file. Click the magnifying glass icon under Open to launch the table in the BigQuery console.

#
Example Query
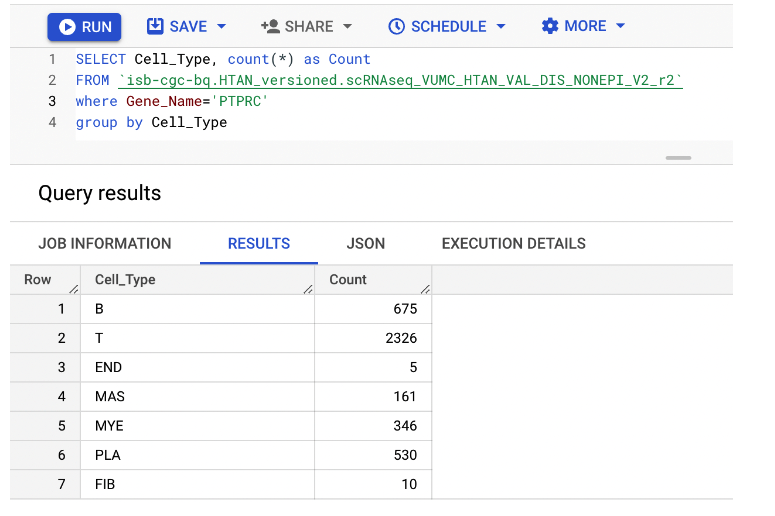
In this example, we query the single cell RNA seq-derived gene expression data for non-epithelial cells in colon polyps published by the Vanderbilt HTAN center. We filter cells to those expressing the leukocyte marker CD45, coded by gene PTPRC, and enumerate cells by their identified phenotype (B = B cell, T = T cell, END = endothelial, FIB = fibroblast, MAS = mast cell, MYE = myeloid, PLA = plasma).
#
Accessing Cell Spatial Data
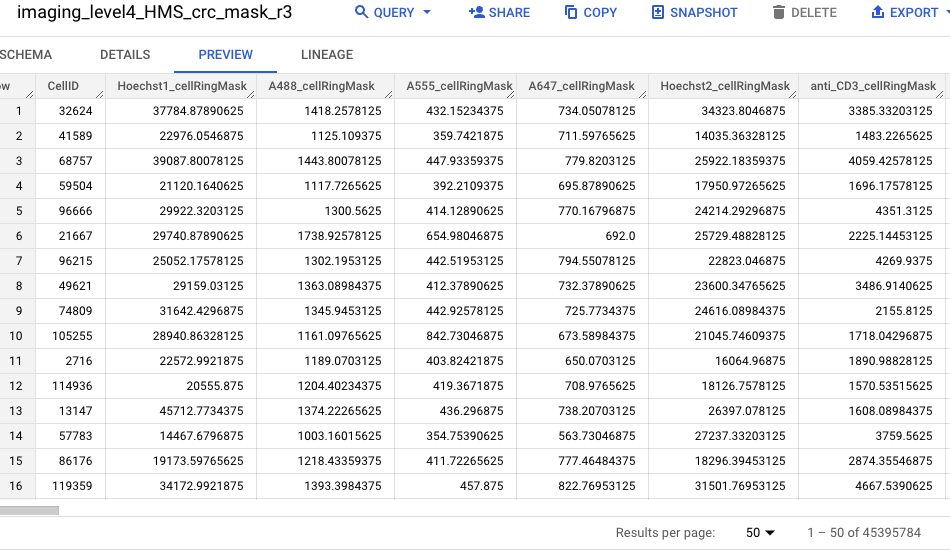
We also host a number of tables that contain information on cellular locations and the estimated expression of key marker protein based multiplexed imaging followed by cell segmentation. These tables are available on ISB-CGC and are derived from Imaging Level 4 t-CyCif files submitted by HTAN centers.
#
BigQuery Notebooks
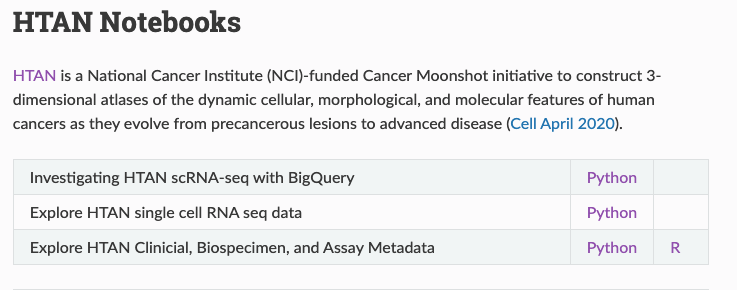
ISB-CGC hosts a public repository of community-generated computational notebooks. The HTAN DCC has contributed a number of R and Python notebooks, illustrating how to query, perform analyses, and generate results using the publicly available HTAN BigQuery tables.
To access HTAN R and Python notebooks, visit the 'HTAN Notebooks' page of the Institute for Systems Biology Cancer Gateway in the Cloud (ISB-CGC) documentation
